The Present Value of a Business is derived by estimating each value driver (sales, operating profit, investments, income tax and cost of capital) which affects the
value of the business and arriving at the cash flows to infinity. The best way to start understanding intrinsic valuation or discounted cash flow valuation is by
getting a bird's eye view of the Valuation Process Chart given below as Figure 1:
Figure 1
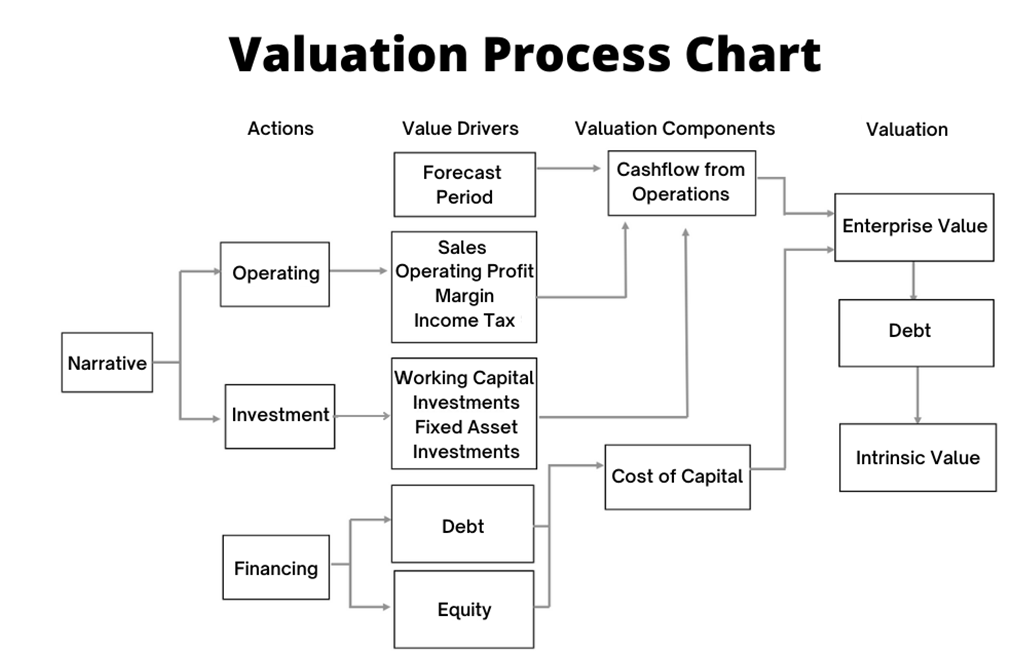
Thus, as one may see, we need to estimate all the value drivers to arrive at the cash flows and then discount it back to arrive at
the present value. These depend upon various management thoughts around narrative, investment, operations, and financing.
What is Discounted Cash Flow Valuation
Discounted Cash Flow Valuation is where we determine the value of business by forecasting free cash flow to perpetuity and then discount it back
to the present with the cost of capital to arrive at the present value of business.
See Table 2 which explains the Valuation Process Chart in numbers.
Example of Computation of Valuation
Table 2
| Year |
Sales |
Growth Rate |
OPM |
Operating Profit |
Tax |
Investment |
FCF |
Discount Factor |
PV of FCF |
| 0 |
1000 |
|
|
|
|
|
|
|
|
| 1 |
1250 |
25% |
2% |
25 |
6 |
100 |
-81 |
0.93 |
-76 |
| 2 |
1500 |
20% |
5% |
75 |
19 |
100 |
-44 |
0.87 |
-38 |
| 3 |
1755 |
17% |
10% |
176 |
44 |
102 |
30 |
0.80 |
24 |
| 4 |
2018 |
15% |
15% |
303 |
76 |
105 |
122 |
0.75 |
91 |
| 5 |
2240 |
11% |
20% |
448 |
112 |
89 |
247 |
0.70 |
172 |
| Cumulative Present Value of Cash Flows |
174 |
| Present Value of Terminal Value |
3189 |
| Debt |
1000 |
| Intrinsic / Shareholder Value |
2363 |
| Outstanding Shares |
100 |
| Shareholder Value Per Share |
23.63 |
Assumptions
|
|
Post Tax |
Weights |
Weighted Cost |
| Inflation |
2% |
|
|
|
| Cost of Debt |
4% |
3% |
25% |
0.75% |
| Cost of Equity |
9% |
9% |
75% |
6.75% |
| WACC in Nominal Terms |
|
|
|
7.50% |
In summary, the Process of Valuation involves defining/estimating the following:
- Define the Story/Narrative: This is your story! What the company is doing, what its Business Model is, where it is going, what's its competitiveness.
- Guesstimate the Forecast Period: This involves estimating what is the market opportunity, the competitive advantage of the company, how long will it last, how long will the company earn above its cost of capital.
- Estimate the Sales and Sales Growth Rate during the Forecast Period: This involves evaluating what is the market opportunity, what is the industry growth rate, and what is the likely market share that the company will have.
- Arrive at the Operating Profit Margin (OPM): What is the OPM today, what is the industry OPM, and at scale what will the OPM be
- Estimate the Incremental Investments: How much investment is required in fixed and working capital to achieve sales growth and target OPM
- Compute the Cost of Capital: What is the rate at which the company can borrow, what are the risks in the company, and what are the expected returns for investing in company shares
- What are the Cash and Marketable Securities, and Surplus Investment that the company carries in its Balance Sheet
- What are the Debt and Obligations, Contingent Assets and Liabilities of the company
The Valuation Process Chart depicts the essential link between the Narrative to Value Drivers - forecast period, sales growth rate, operating profit margin, income tax, fixed and working capital investments, and cost of capital to its Valuation.
Operating Decisions such as cost of goods sold, pricing, manpower costs advertising & distribution, administrative expenses and income tax rate are incorporated in three value drivers - sales growth, operating profit margins, and income tax.
Investment Decisions such as expansions and acquisitions are reflected in fixed assets investment rate and receivables, payables, inventory policies etc., are reflected in the net working capital investment rate.
Cost of Capital reflects business risk and financing decisions
Finally, to obtain intrinsic value for shareholders, debt is deducted from enterprise value.